


Bayern’s “Hinrunde” in numbers
Michael Karbach regularly turns Bundesliga statistics into charts and graphs and publishes them on Twitter as @BStat and on his website. Although his main focus is on Gladbach, his analyses often allow for interesting insights into other teams like FC Bayern and the league as a whole.
Continued dominance
33 points and only third in the table – that is what Bayern’s record shows after the first 17 matchdays of the 2019/20 Bundesliga season. This was their worst Hinrunde since 2010/11, a season in which emergency coach Andries Jonker just managed to lead the team to a Champions League qualification place. The dominance of previous years seems gone.
(Source: Michael Karbach)
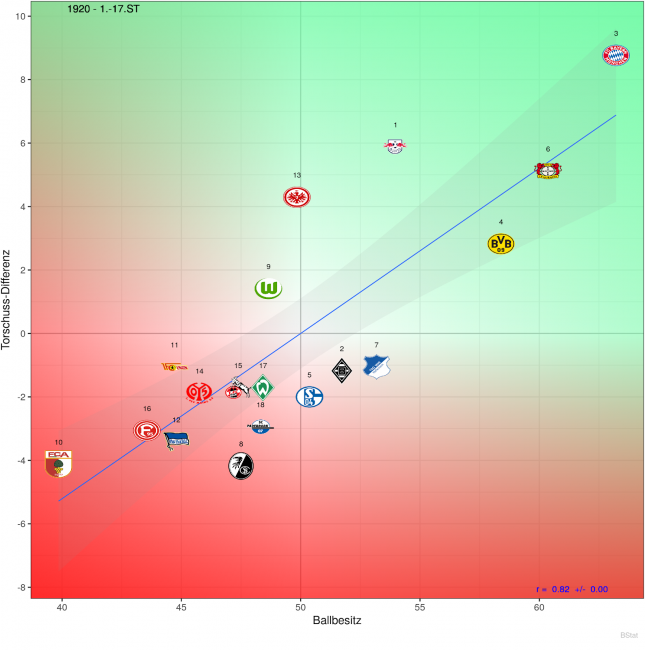
However, a look at the data reveals that Bayern still dominate most games, even though this might feel different when watching them play. Bayern lead the league in both share of possession and number of attempts created less attempts conceded per game. The freak game against Frankfurt was the only one where the opponent created more chances than they did. Bayern’s average of 18.6 attempts per game is the league’s highest return, followed by Frankfurt with 17.2. At the opposite end of the pitch, 9.8 shots conceded also puts them in first place. Here, Bayer Leverkusen is the team closest on their heels with 10.2 shots conceded.
An overview of the Hinrunde
(Source: Michael Karbach)
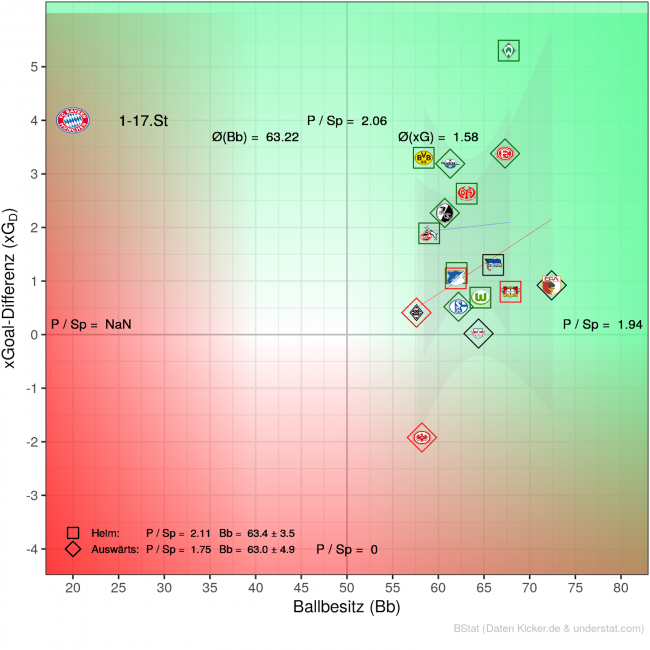
Taking a look at the games individually further solidifies the picture. This chart displays the xG difference between Bayern and the respective opponent compared to the share of possession. In terms of xG, Bayern outperform their opponents by an average of 1.58 xG per game. This is also the best value in the league. Once again, the defeat against Frankfurt is the only outlier. The draw against Leipzig saw both teams also level on xG. Even in the defeats against Gladbach, Hoffenheim and Leverkusen, Bayern was ahead on xG. In total, they managed to achieve an xG difference of +3 four times.
The Flick effect
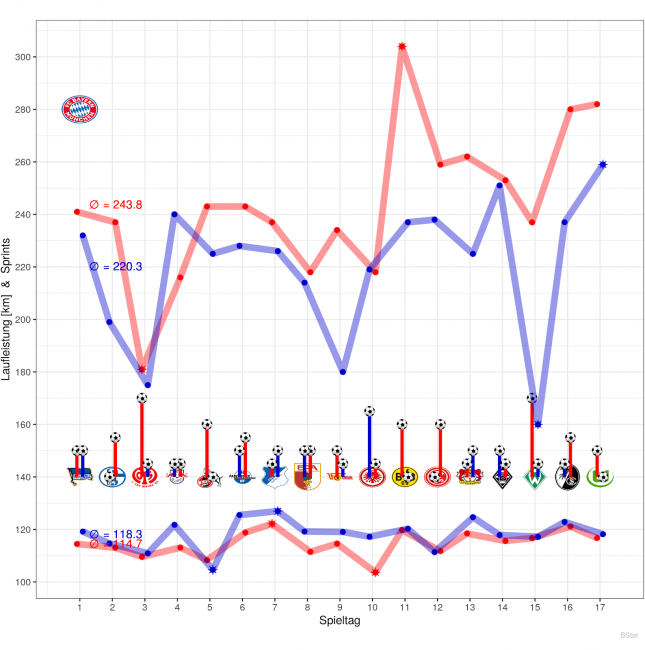
An interesting statistic shows the number of sprints. Only FC Schalke had more sprints than the record champions. The chart also shows an interesting trend change over the course of the season. The upper red curve shows the number of sprints per game for Bayern. The lower one shows the corresponding number for each opponent. After the change of coach on matchday 11, there is a significant increase in this figure. All six matches with the most sprints by Bayern in the Hinrunde came in the first seven matches under coach Hans-Dieter Flick.
(Source: Michael Karbach)
The reason for this is twofold: First, Flick introduced a consistent gegenpressing, which automatically leads to more intensive runs. On the other hand, there is also an increased motivation of the players who now pull in the same direction again.
In terms of total distance covered (lower pair of curves), Bayern almost traditionally has low values, although a small increase is also noticeable here after the takeover of Flick. In general, however, the record cup winners prefer to let their opponents do the running. They average a full 3.7 km more than Bayern in a match. Running less makes sense for a superior team, as it means that the opponent has to work hard while they prefer to let the ball run. In general, however, the correlation between winning probability and running distance is rather small.
Weak defense by chance?
FC Bayern conceded a total of 22 goals in the first half of the season. This amounts to the most porous defence since 2008/09. Since then, Bayern have conceded as many or even fewer goals in total in five seasons. Here too it is worth taking a detailed look at the statistics.
(Source: Michael Karbach)
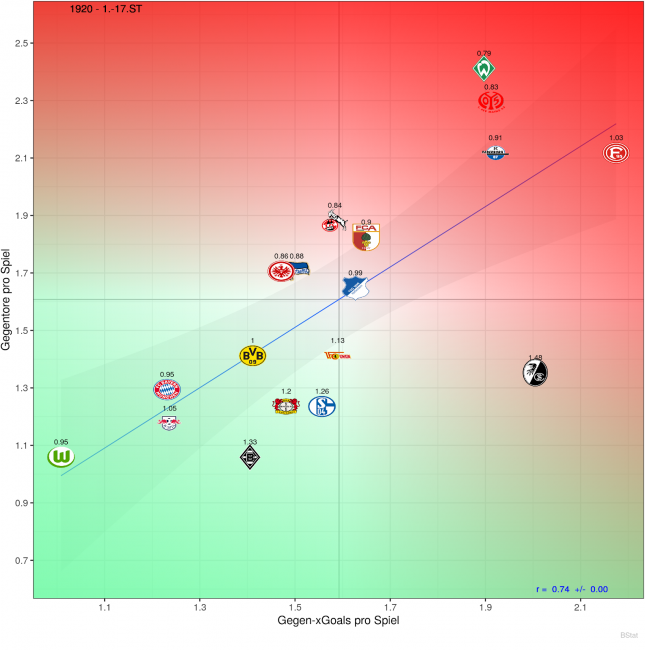
Five teams had a better defense than Bayern in the Hinrunde. And this despite the fact that they concede the fewest shots on goal. The metric of xG against also suggests that Bayern have a stable defense. Here they are in second place level with RB Leizpig.
However, it should be noted that the figures are higher than in the past. In the years under Pep Guardiola, the average number of shots conceded per game was around 7.5. Under Ancelotti, the peak was 8.9. This season, the figure is well above this level with 9.6 shots conceded per game. An increase of two shots conceded on average is definitely significant.
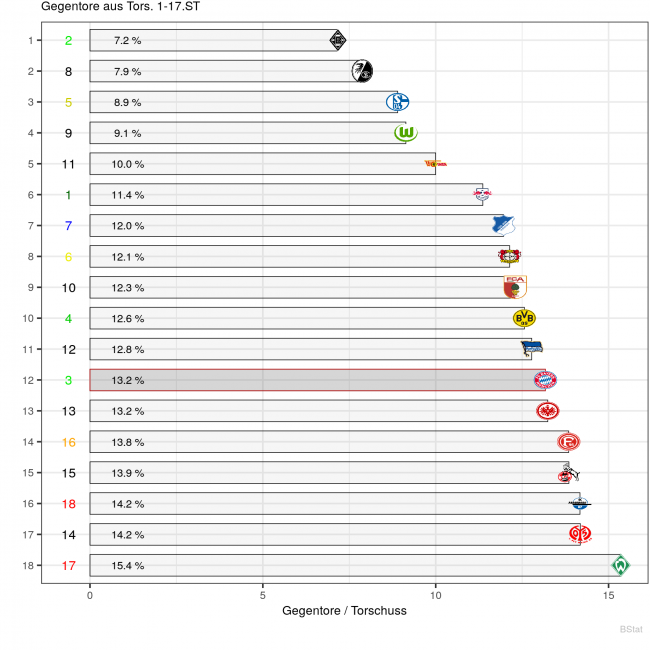
What is most concerning, however, is how many conceded shots end up being a goal. Here the team suddenly finds itself in the bottom half of the table, way off the pace of the top performers. A total of 13% of all conceded shots result in a goal – and probably Manuel Neuer waving his right arm in complaint. This proportion puts Bayern in 12th place and in the best company of relegation candidates like Düsseldorf and Paderborn. A look at xG against reinforces this impression only further.
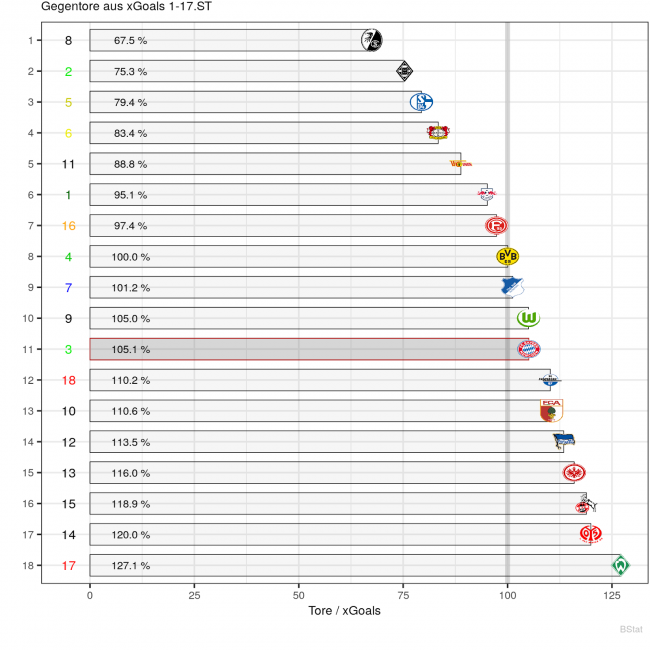
But what conclusions can be drawn from this? The low number of conceded shots indicates that the record champions do not allow many chances overall. The still relatively low number of xG against also indicates that the chances they allow are not necessarily promising. So is Manuel Neuer having a weak season? Not at all. With his saves, the goalkeeper has even kept his team in the game many a time.
Perhaps Bayern’s opponents simply are extraordinarily lucky at converting their chances? According to understat.com, this season is the second of the record champions in which their xG against are lower than the actual number of goals they have conceded. The other one? 2018/19. Is this just a coincidence?
Where is the offense?
Finally, let’s take a look at FC Bayern’s attack. 46 goals scored at the turn of the year is a tally that was last surpassed in the late 70s. Does this mean that Bayern’s offense has gone into overdrive?
(Source: Michael Karbach)
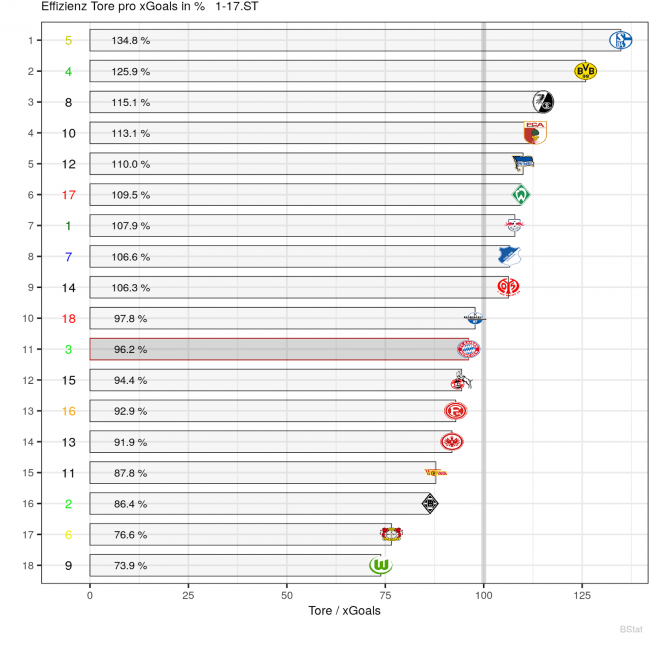
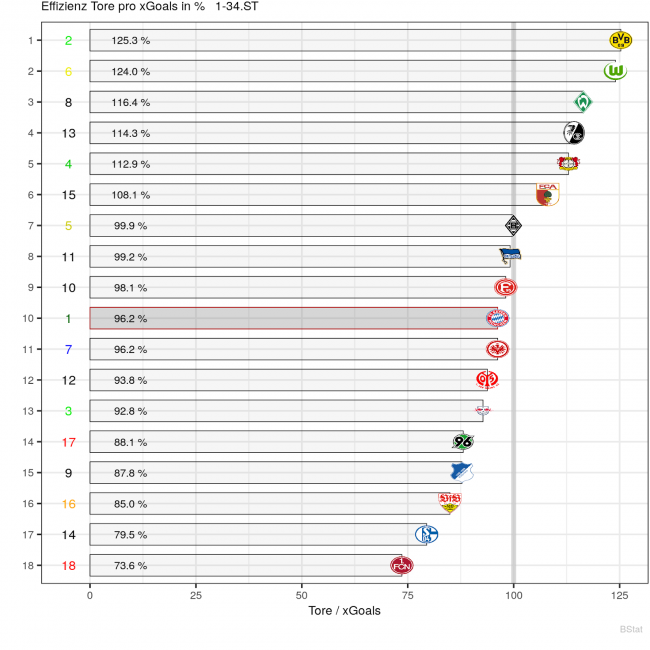
With 2.82 xG per game Bayern are ranked first in the league ahead of RB Leipzig (2.62). However, Leipzig scored 48 goals in the Hinrunde. Once again, it is interesting to look at the ratio of xG to actual goals scored. Here FC Bayern is below a level balance. This means that they have a higher xG value than actual goals scored. In this metric, this puts them in a mid-table position in the league. This continues a trend from last season (compare the chart below).
(Source: Michael Karbach)
Consistently strong here, however, are Dortmund. Favre teams almost traditionally beat their xG value. Freiburg and Augsburg are also consistently in the top third. Bayern, however, are in uncharted territory. Heynckes, Guardiola, and even Ancelotti have consistently overperformed in these statistics.
A possible answer to this could lie in the quality of the chances. Let us take a look at the xG per attempt figures over recent years. In the last two years, the value for xG per attempt from open play was 0.17 and 0.16. Looking at the years prior to that, it was consistently lower at 0.13 under the above-mentioned coaches. This means that Bayern have tended to have even better chances in recent years.
Conclusion
Compared to their domestic competition, FC Bayern is still in a very good place. All statistics attest to that relatively clearly. However, the dominance of previous times has somewhat diminished. Both in attack and in defense, the team underperforms its xG values. The fact that Bayern still have one of the best attacks and defenses in the league should be seen as a warning sign for the Bundesliga.
The change of coach to Flick has definitely produced an effect. The increased intensity on the pitch seems to help the team. If the coach now manages to increase his team’s chance conversion rate in attack as well, Bayern statistically will be the favourites for the title.
All statistics used in this article are accurate as of the time of the winter break. There may be inaccuracies in the expected goals, as this metric is still relatively new and constantly developed further.
You can find more Bayern statistics from Michael Karbach and other accounts on our Miasanrot stats account on Twitter.


