


MSR awards season 20/21: Stats Corner – Part 1
First, let’s look at some general statistics for the Bundesliga. Whether a club scored 80 or 90 goals may be of interest to football historians and number crunchers (myself included), but always more exciting is the comparison with the direct competitors. In the following charts, each point represents the overall season’s performance of a Bundesliga team. The performance of FC Bayern München is marked in red.
A first high level overview
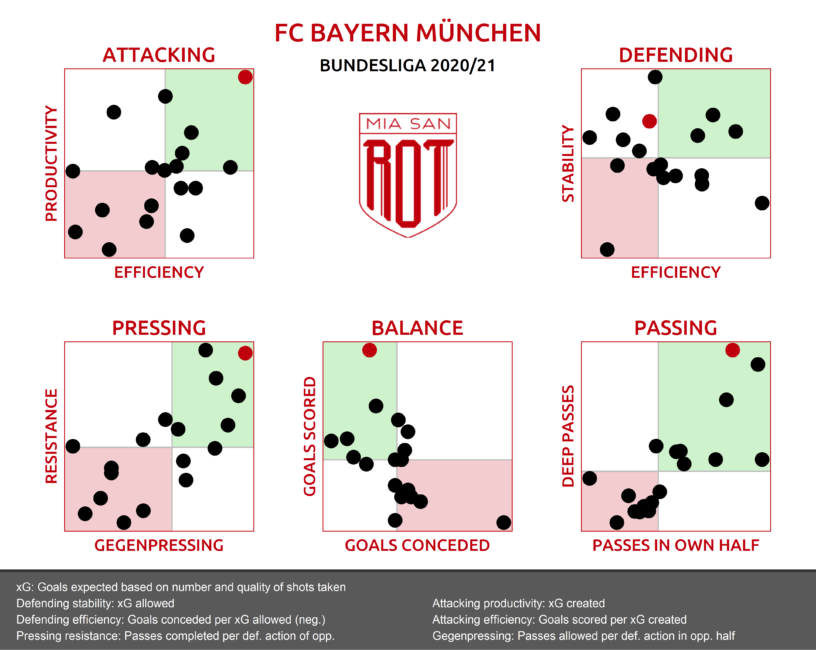
This initial overview already gives a good indication of what has made Bayern stand out under Hansi Flick, especially in the past season.
The statistics for Bayern’s offensive are unparalleled. The graph at the top left shows the number and quality of the chances created by a club on the y-axis, as well as the efficiency in converting them into goals on the x-axis. In neither of the two dimensions are there any other clubs that came anywhere near Bayern last season.
The other side of the coin, however, is the defense. The graph on the top right shows the number and quality of chances conceded on the y-axis (the higher the better). The x-axis shows the number of actual goals conceded in relation to chances. Clubs in the upper right quadrant, therefore, conceded few chances and also conceded fewer goals from the few chances than would be expected on average. Clubs in the lower left quadrant, on the other hand, both conceded more goals than would have been expected on the basis of the chances and, on top of that, had a defence that allowed the opponent to create a lot of scoring chances.
FC Bayern ranks somewhere in midfield for this indicator among all Bundesliga teams.
The graphics on the bottom left, middle, and right focus more on Bayern’s style of play. Characterised by aggressive counter-pressing coupled with strong resistance against opposing pressing, as well as an offensive play which mainly took place in the opponent’s half and was set up for deep, vertical passes to the front line, Bayern ultimately played their way to the championship despite a shaky defense.
In the following, we take a closer look at Bayern’s offensive and defensive performance.
Goals and goals against in historical comparison
By comparing the number of scored and conceded goals with previous Bundesliga champions, it becomes obvious how exceptional the season really was.
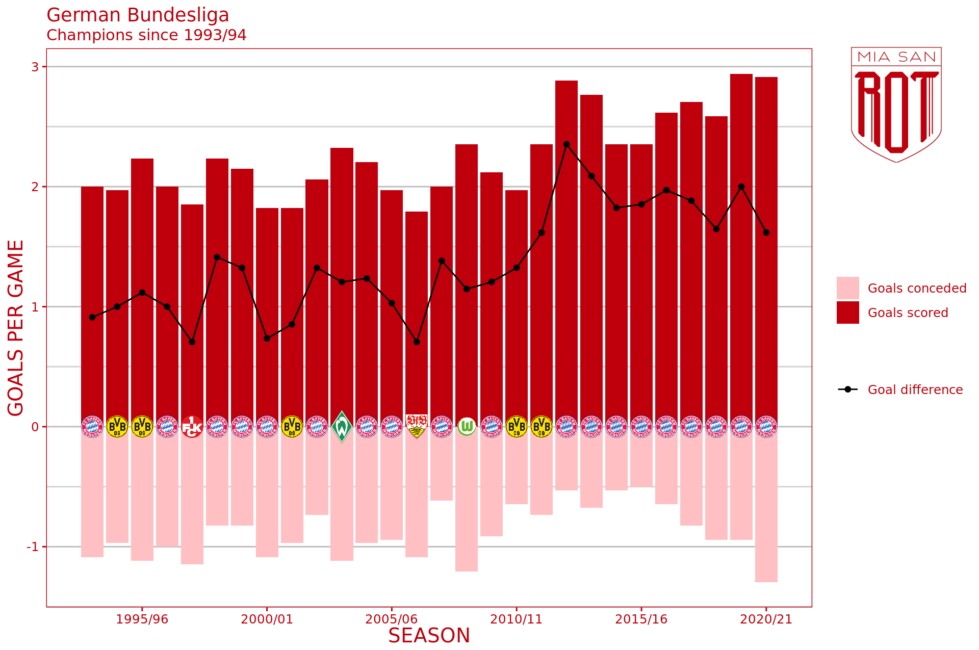
Although Bayern did not quite reach the goal tally from last season, the 98 goals from the penultimate treble season 2012/13 could be surpassed by one in the end. The goals conceded, however, were also almost unprecedented. No champions since 1993/94 have conceded more goals than Bayern.
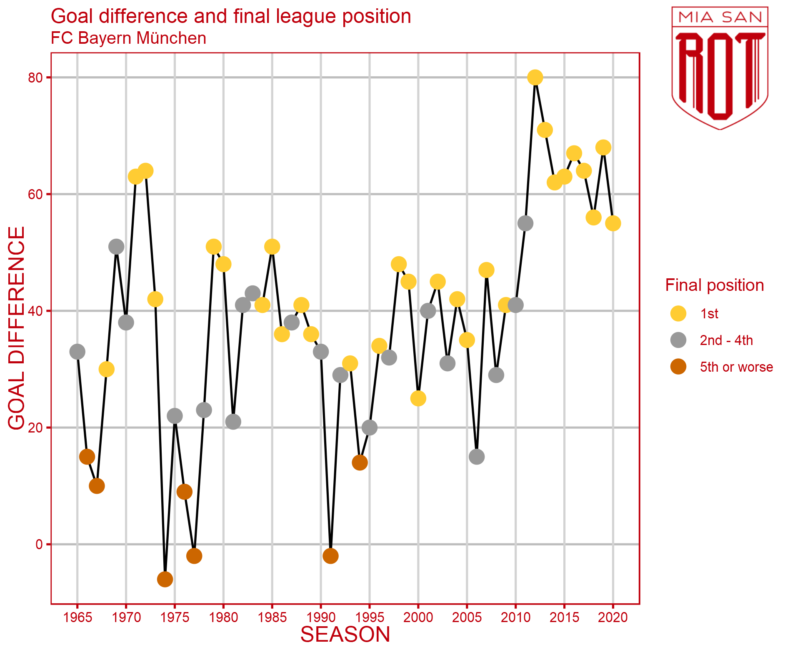
However, the high number of goals scored helped Bayern to conceal many things. A look at the goal difference shows their dominance since 2012. In this period, FC Bayern always ended up with a goal difference of at least +55. A value that was only reached (and never beaten) once before by one other club in the period under consideration – Borussia Dortmund in 2011/12.
Goals conceded by champions and relegated teams
The very high number of conceded goals stays extraordinary even if we extend the analyzed time span to the entire history of the Bundesliga.
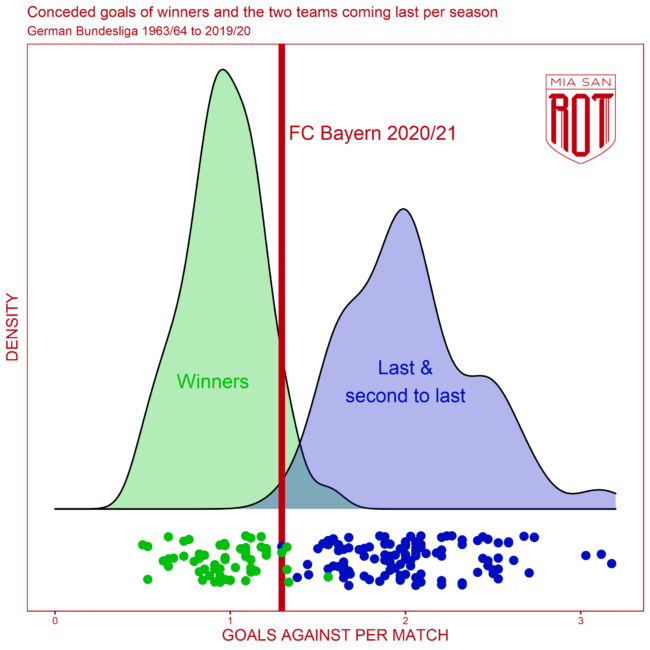
The above chart contains every season since the Bundesliga was founded in 1963. Each green dot represents the number of goals conceded by the respective season’s champions. The same for the last two teams in the final table in blue.
In comparison with all the champions since the Bundesliga came into existence, only three clubs have conceded more goals than Bayern in the current season with 44 goals: 1. FC Kaiserlautern in the 1990/91 season and Hamburger SV in the 1981/82 season with 45 goals each. And FC Bayern themselves in the 1973/74 season with an incredible 53 goals.
Borussia Mönchengladbach, a club with the same number of goals conceded as FC Bayern in the current season (44), in that return even managed to get relegated to the 2nd Bundesliga in the 2006/07 season.
Now that we have compared the goals conceded with other champions, we would like to contrast FC Bayern’s performance of last season with that of previous years.
Goals conceded by FC Bayern
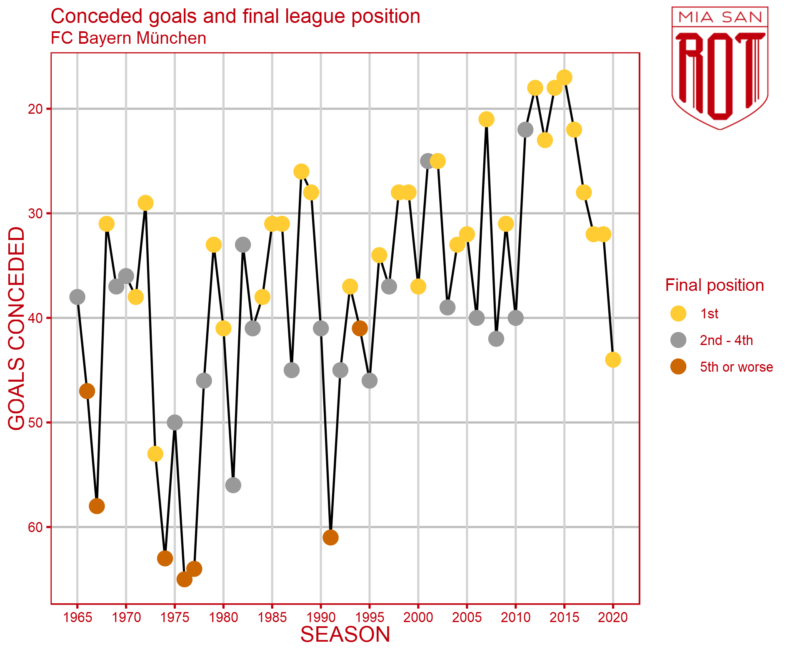
This graph now allows us to identify some trends and peculiarities.
First of all, it is obvious how dominant FC Bayern were, especially in the seasons 2011/12 to 2016/17. Even if it was not enough to win the championship in the first year, FC Bayern could always rely on an extremely strong defense.
At the same time, however, it should be noted that the number of goals conceded has steadily worsened since the record-breaking 2015/16 season and now seems to be in a range that historically has usually not been enough to be crowned champions at the end of the season.
As already pointed out, however, for the whole picture the numberof goals scored needs to be taken into account as well.
Goals scored by FC Bayern
A look at the goals scored immediately reveals the most offensively prolific periods of FC Bayern. The seasons 1971/72 to 1973/74 and 2012/13 to 2020/21 are clearly visible peaks. The first real peak in the 1970s should also serve as a warning of how quickly a record-breaking offensive can collapse from one season to the next. And this without any major personnel changes (because even though FC Bayern lost Paul Breitner, among others, to Real Madrid for the 1974/75 season, with Uli Hoeneß and Gerd Müller the top scorers from the previous year stayed at the club).
In addition to the penetrating power of the offensive, the chart also shows FC Bayern’s dominance in the Bundesliga. Reaching nine titles in a row are unprecedented in the Bundesliga and this figure is also outstanding in international comparison.
German football champions again
The following visualization shows the champions of the top five European leagues over the last 50 years, each sorted by the number of championships in that period.
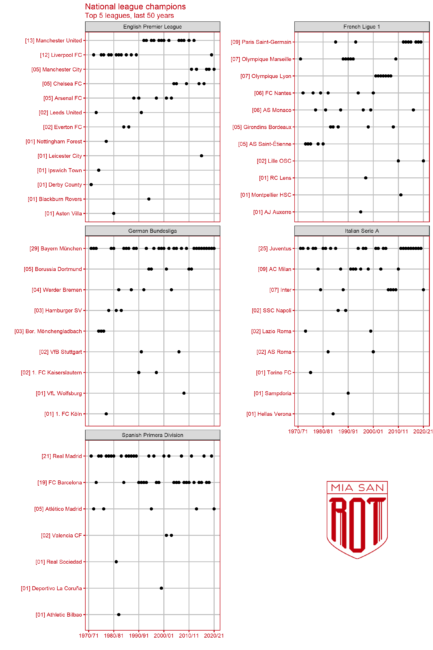
As the charts show, each league seems to have its own characteristics. The English championship is characterized by two long eras: that of Liverpool FC between 1973 and 1989 and that of Manchester United starting with the creation of the Premier League in 1992/93 and ending with the departure of Sir Alex Ferguson at the end of the 2012/13 season. Even though in both periods the majority of championships went to the dominant team at the time, other clubs always managed to snatch a title here and there. In total, Liverpool FC and Manchester United won 25 of the 50 championships.
In France, the dominant eras are much shorter and spread over several teams. AS Saint-Étienne were champions five times in the 1970s. Olympique Marseille did the same between 1989 and 1993 (although their last title was subsequently stripped from them due to the so-called “OM-VA affair”). Olympique Lyon won the most championships in a row between 2002 and 2008. Paris Saint-Germain’s dominant period began in 2013, briefly interrupted by Monaco and OSC Lille in the past season. In total, no club has won more than nine championships in the last 50 years. This is unique in the five European leagues under consideration.
In the German championship, there is no way around FC Bayern. Only in the Bundesliga has a club managed to win more than half of the last 50 championships. The dominance of the record champions is so great that no other club has really ever succeeded in carving out a longer successful era for themselves. Borussia Mönchengladbach in the 70s, Hamburger SV in the early 80s, as well as Borussia Dortmund in the mid-90s and between 2010 and 2011, had brief periods of superiority. However, their spells were always quickly broken again – mostly by FC Bayern.
A similar picture emerges in Italy. Juventus Turin have been very dominant over the last 50 years, only allowing the two Milan clubs to develop their own winning streaks for short periods.
Finally, Spain is characterised by the duel between FC Barcelona and Real Madrid. Unlike in England, other clubs rarely have the pleasure of intervening in the duel between the two giants.
Champions of the hearts – champions of the numbers
Even if it looked close for a period of time, in the end the Bavarians were able to finish 13 points ahead of the second-placed RB Leipzig. So it is reasonable to talk about a rather decisive win of the championship. Or is it?
Expected Goals
To answer this question, it is worth taking a look at the “expected goals”. This metric has managed to move from a statistical gimmick to the football mainstream in recent years. Today, “goal probabilities” are regularly presented in Bundesliga broadcasts. Expected Goals are just that. Based on information such as finishing position, number of defenders between the ball and the goal, type of assist and many other factors, each finish is assigned a probability of scoring. This is done by analysing large amounts of historical data on goals. The simplest example often used to explain this is the penalty kick. Penalty kicks are converted at an average rate of ~77%. Individual strengths of individual players are not taken into account. Therefore, the goal probability (or the “Expected Goal” value, or xG for short) of a penalty kick is always 77%, regardless of who the penalty taker is.
The sum of all goal chances of a team then makes up the expected goal value for the match. Based on this, it is now possible to simulate a season. The simplest method would be to simply compare the expected-goals values of the two teams playing against each other and award three points to the team with the higher value (as was done recently by German football magazine the Kicker, for example). That this approach is somewhat short-sighted quickly becomes clear when, in a fictitious example, one team could not create a single chance (xG = 0) and another team has a single goal with xG = 0.5. In this example, it would be too simple to say that the team with the one shot always wins the game. In fact, they would only win 50% of the matches and 50% of the matches would end in a goalless draw. For our simulation, we therefore simulated the past season several 10,000 times and analysed the resulting final tables based on the expexted goals scored. The result is impressive and shows Leipzig in first place on average:
| Team | Average Predicted Position | Actual Position | Winning chance | Average Predicted Points | Actual Points |
|---|---|---|---|---|---|
| RB Leipzig | 1.99 | 2 | 49.4 % | 67.5 | 65 |
| Borussia Dortmund | 2.86 | 3 | 23.8 % | 63.4 | 64 |
| FC Bayern München | 3.12 | 1 | 18.9 % | 62.4 | 78 |
| VfL Wolfsburg | 5.5 | 4 | 3.8 % | 55.5 | 61 |
| Eintracht Frankfurt | 5.96 | 5 | 2.2 % | 54.3 | 60 |
In almost 50% of the simulations, RB Leipzig could celebrate the championship in the end. Even more surprisingly, Borussia Dortmund ends up in second place in most cases and has a higher overall probability of winning the championship than FC Bayern.
Potential conclusions
First of all, for winning the championship it is of course crucial to score actual goals and not just analytical “expected goals”. But does that completely invalidate this analysis? To answer this question, let us take a look at possible causes of a discrepancy between actual results and results after expected goals.
A look at the actual points won and the points predicted by the model shows that Dortmund and Leipzig are quite close to the expected result, while FC Bayern have exceeded their average expected points by more than 15.
As already described, the calculation of expected goals ignores the individual strengths (and weaknesses) of individual players. In reality, of course, this is not the case. There is no question that Robert Lewandowski has a higher chance of converting a certain goal chance than other players. It is not for nothing that clubs pay hundreds of millions to sign and employ certain players. So if we hypothetically assume that FC Bayern players on average score more actual goals from an expected goal than players from other clubs, this can be a first explanation for the fact that the table situation after expected goals would be worse than the actual performance.
Similarly, it could be assumed that, for example, RB Leipzig lost offensive penetrating power after the departure of Timo Werner (no Leipzig striker was in the top 10 Bundesliga scorers in the past season) and therefore does not manage to convert their chances as clinically as their competitors from Germany’s south. This argumentation seems less convincing when Borussia Dortmund and, with them, Erling Haaland are taken into consideration, but nevertheless, as already stated at the beginning of the article, FC Bayern clearly exceeded their expected goals in comparison to other Bundesliga teams.
We can therefore conclude that it is to be expected that clubs with an above-average squad exceed their expected goals particularly often. At the same time, however, FC Bayern should by no means rest on their laurels and ignore RB Leipzig’s “expected championship”. The bottom line of this analysis is that Leipzig managed to generate more and better goal chances (or at least to distribute them better in the important games). Leipzig, however, failed to win eleven games despite having the upper hand in terms of expected goals. For FC Bayern, this number was only five games. With a little more luck at finishing, a better striker, or even Robert Lewandowski being just a little less world class, the champions this past season would have been RB Leipzig.
The Bayern team’s luck becomes all the more evident when we widen our analysis to include the last few seasons as well.
FC Bayern’s “expected championships”
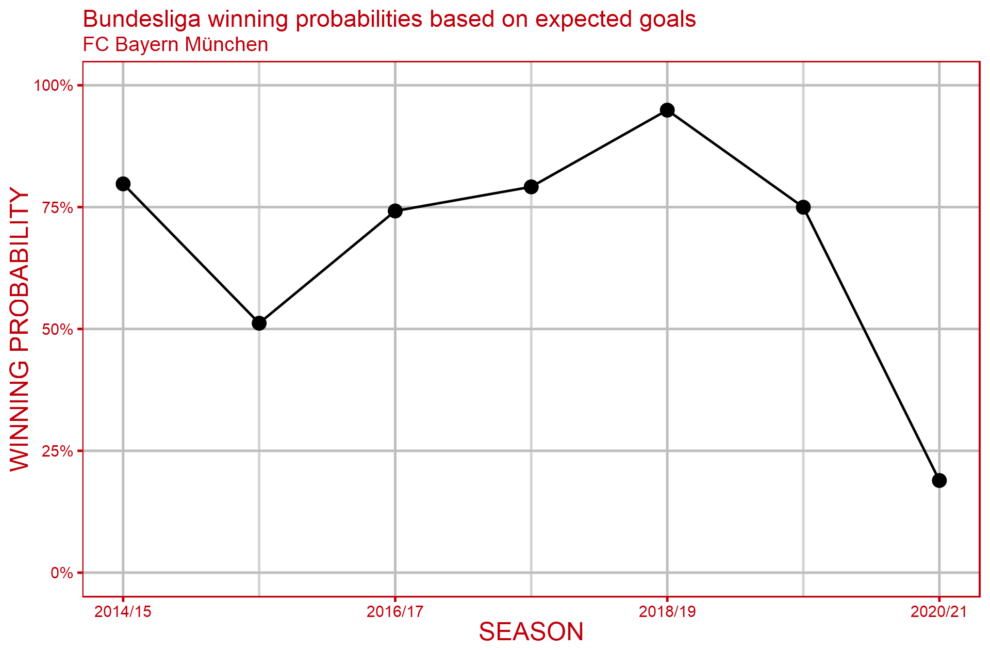
It is clear to see in this chart that it is by no means usual for FC Bayern to gain the upper hand only by exceeding their expected goals. In the last six seasons, FC Bayern have always secured the simulated championship with a probability of over 50%. In five of the last six seasons, the probability even was at least 75%.
Home turf advantage
To conclude this first statistical review of the season, we should also briefly talk about the obvious big anomaly of the season. With a few exceptions, all the games took place in front of empty stands and thus without the support of the fans. This is certainly worth mentioning for many reasons, and the last one and a half seasons hopefully were not only the first but also the last ones under these conditions; nevertheless, we would like to talk briefly about the impact this has had on home advantage. On average over the last 5 years, a home team has been able to secure around 60% of the points they needed to win the biggest European leagues. The explanation often given for this is that players perform slightly better when they are cheered on by their supporters. This effect is reinforced by the possible intimidation of the visitors by the home fans.
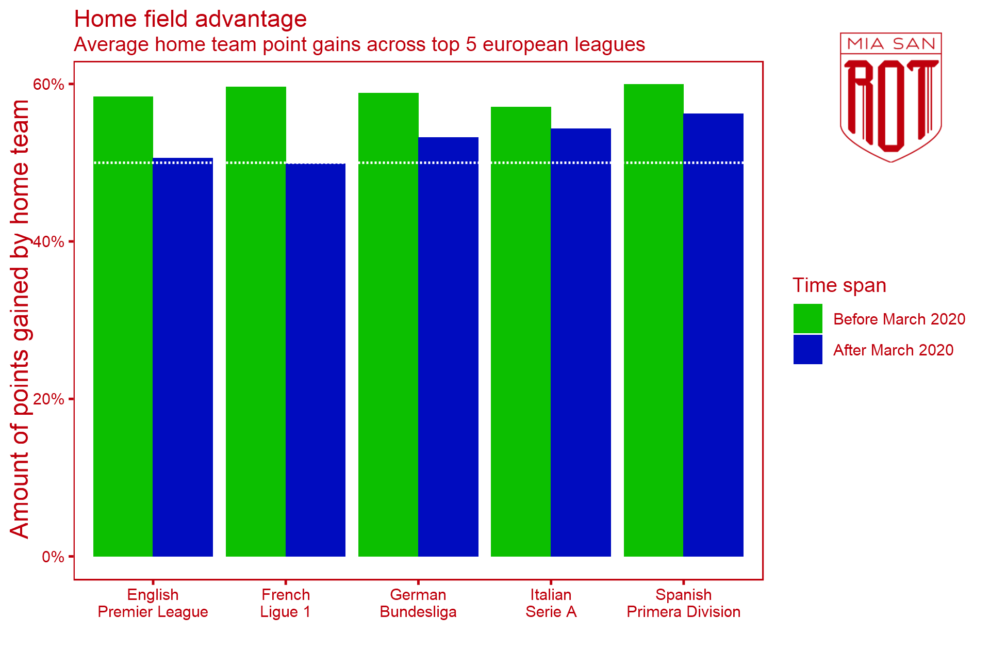
It is therefore unsurprising that this home advantage does not come into play when playing before empty ranks and thus a clear decline in the importance of this factor can be seen with the start of the “ghost games”. In England and France, the home advantage seems to have been almost completely eradicated. In Germany, Italy and Spain there is also a significant decline, but there is still a statistical home advantage. This is very interesting in that in the past it was only possible to isolate and investigate possible influencing factors in a game to a limited extent. Now it seems clear that other effects such as less travel stress, more self-confidence in one’s own stadium, etc. also seem to have a significant influence. Although perhaps not to the same extent in every league.
CONCLUSION
So with the season just ended an extraordinary season in many ways came to an end. Not only did we see an outstanding offensive performance as well as surprisingly defensively fragile performances, but we were also treated to a record-breaking ninth consecutive championship by FC Bayern. The change in the coaching position, departures of key players and the lost “expected championship” promise a 2021/22 season that will be at least as exciting.
In the next part of this short series we will take a closer look at the player statistics of the past season with a special focus on the performances of the FC Bayern players.


