The MSR Fiver: The first part of the season in numbers
Disclaimer: This analysis refers to the first 13 matchdays of the season. The first game of the new year against Mainz is not included.
1. Efficient in attack
The Bayern team got off to a furious start to the 2020/21 season with an 8-0 victory in the opening game against Schalke. Scoring eight goals, albeit against a desolate Schalke side, was a statement. On the following matchdays, too, Bayern went on to break one historic record after another. By the Christmas break, they had scored 39 goals in 13 games. Only twice before had they surpassed this figure in the Bundesliga (in 1976/77 with 44 goals and in 2015/16 with 40).
Although Bayern did not perform at their sparkling offensive best from matchday six onwards, and did not surpass more than two expected goals (xG) in any game, Flick’s team was remarkably efficient.
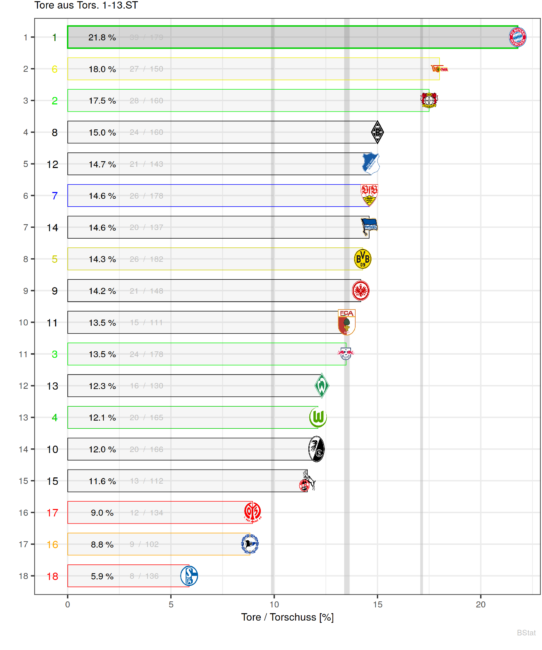
In terms of the shot conversion rate, they are well ahead of their closest challengers, Union Berlin, with 21.8% of the shots resulting in a goal. The gap to 2nd placed Union is 3.8%, which is as large as the gap between the Eisernen and 9th-placed Frankfurt.
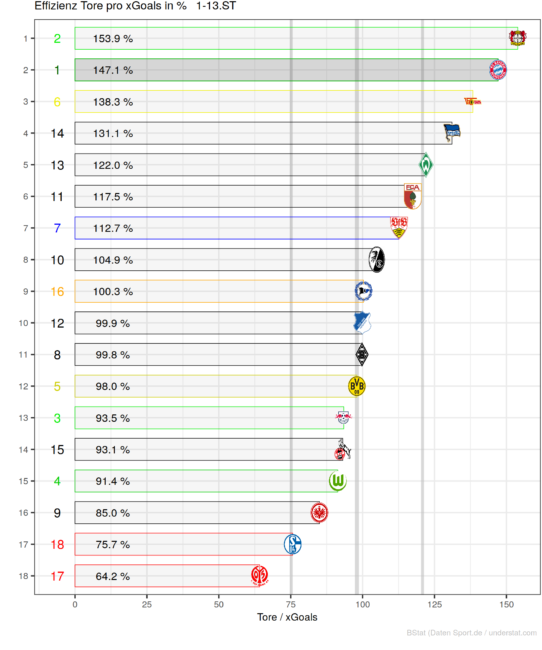
There is a similar picture with regard to the goals to xG ratio. Only Bayer Leverkusen can outperform the Bayern team in this metric. The record champions score almost three goals from two expected goals. This puts them well ahead of such supposed title contenders as Gladbach, Dortmund and Leipzig, who have a return of slightly less than one goal per xG.
This is certainly also due to Bayern’s top-class squad, which contains a number of players who can score even from low probability opportunities.
2. Shaky in defense
The second storyline of the season, however, is the weak defensive performance of the Christmas champions. Bayern have already conceded 19 goals – more than they did at the end of an entire season three times already since 2012.
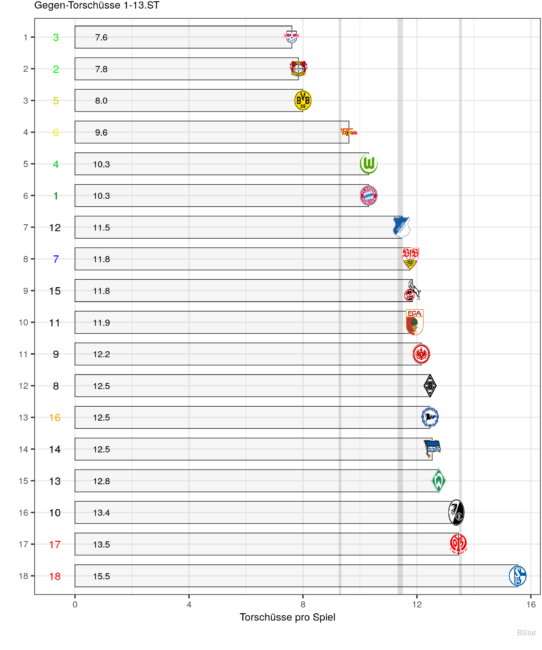
One of the main reasons for this is Bayern’s vulnerability in defense, which allows an average of slightly more than 10 shots on goal per game. This puts them only in sixth place in the league. With 2.7 shots on goal, the gap to leaders Leipzig is as large as the lead over relegation candidate Werder Bremen.
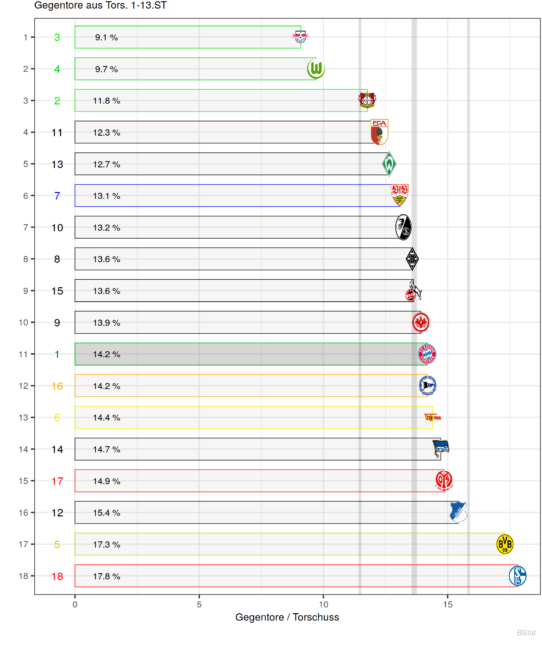
In addition, Bayern concede a particularly high number of goals per shot against. 14.2% of the opponent’s shots end up in the back of Manuel Neuer’s net. And this despite the fact that Bayern’s keeper has an excellent season and has saved his team’s blushes several times already.
Both figures make it clear that Bayern’s defense not only concedes many chances, but that most of these are also high quality opportunities for the opponent. This is certainly a consequence of the very high back line, but also an uncommonly high number of loose passes during build-up play and all too common individual errors.
3. Hard workers
The fall back storyline of the COVID-19 season to explain almost everything is the extremely packed calendar. Bayern are not exempt to that hardship, especially since Hansi Flick has ordered his team a very energy-intensive style of play. The aggressive pressing that has increasingly characterised the team’s game since he took over last season requires a lot of sprinting.
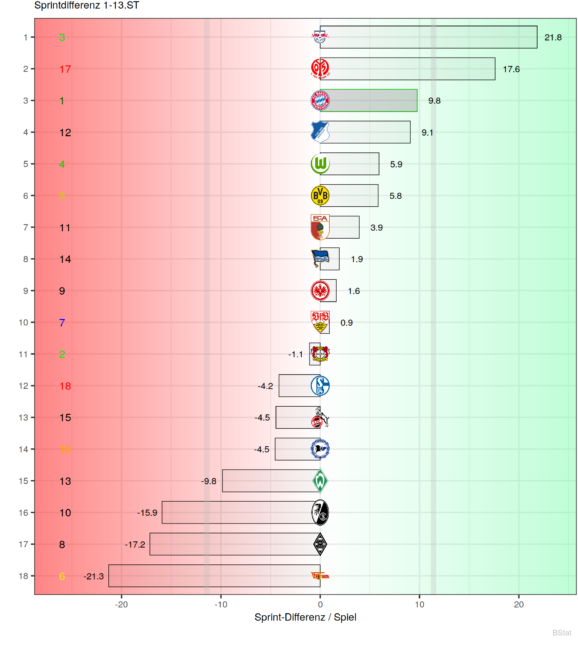
This graph shows the average sprint difference per game. It is astonishing to see that Bayern, despite their energy sapping season, take one of the top positions here. Only Leipzig and Mainz are ahead of the record champions in this category (even if by a significant margin).
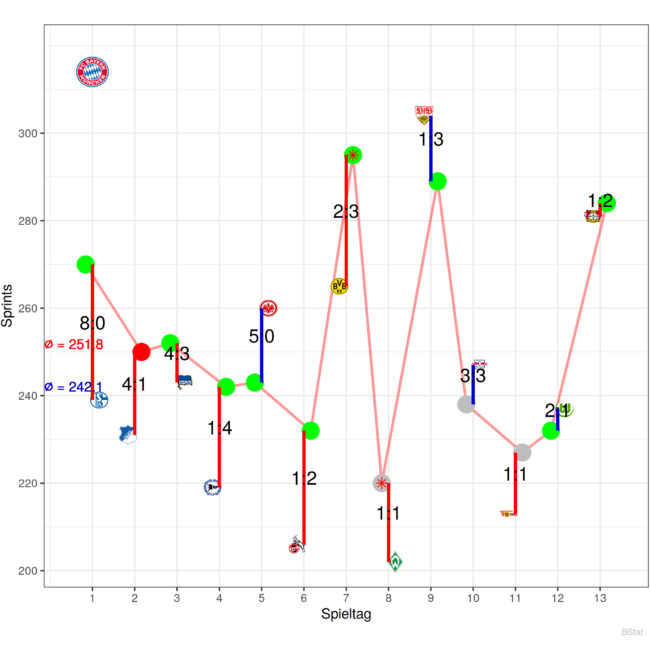
A closer look at the matches shows that although Bayern often sprint more than their opponents (marked by red bars), this does not necessarily correlate with wins (green = victory). In fact, they were the more active team against Hoffenheim, Bremen and Köln, but could not win any of the games.
What is more interesting, however, is that the general trend for Bayern’s sprints is pointing downwards. For the top matches against Dortmund and Leverkusen, however, the team was visibly motivated and churned out season bests in the number of sprints. They won both games.
In the outlier game against Stuttgart, they inevitably had to sprint a lot as they were time and again shown the heels by the lightning quick Swabians on that day.
4. Too fatigued for domination?
A similar picture presents itself for the total distance covered. In this category Bayern almost traditionally chase their opponents. They prefer to let the ball and therefore the opponent run rather than do the running themselves. Once again, the games against Leverkusen and Dortmund stand out.
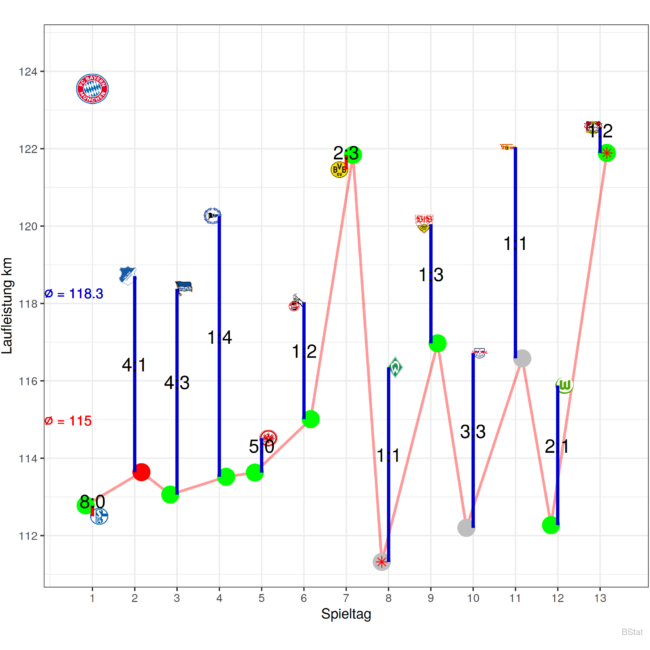
Es zeigt sich aber auch, dass die Münchner auf dem Zahnfleisch gehen. Der Laufwert von 111,2 Kilometern gegen Bremen sagt viel über das Spiel aus, das teilweise den Eindruck eines Nicht-Angriffs-Paktes vermittelte. Ohne die vielen kleinen Extraläufe leidet auch das Positionsspiel der Münchner.
Die drei Partien mit der niedrigsten Laufleistung fielen entsprechend auch alle in die Phase ohne Duracell-Häschen Joshua Kimmich.
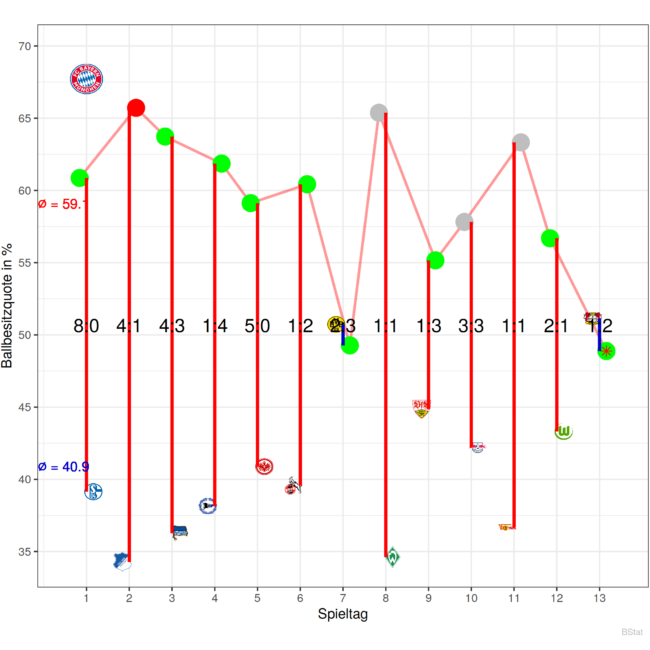
Analogous to the running statistics, it is also worth taking a look at the possession rate. With an average of 59%, this is lower than in previous years. In two games, the record champions even ended the match with less than 50% possession. In fact, they no longer lead the league in possession with Dortmund actually being a few points ahead.
However, it is also worth mentioning that Bayern failed to win all three games in which they had the highest ball possession. Flick’s Bayern in times of COVID-19 are definitely a different animal.
5. Low point under Flick
And that brings us to the final graph, created by our Miasanrot resident stats guru Lukas. The graph shows the rolling xG difference over ten games for FC Bayern since the times of Pep Guardiola. This metric was recommended in Episode 3 of The Football Pod with Data Analyst David Sumpter – The Football Pod.
By way of contrast we have added the actual goal difference and points average for each coach.
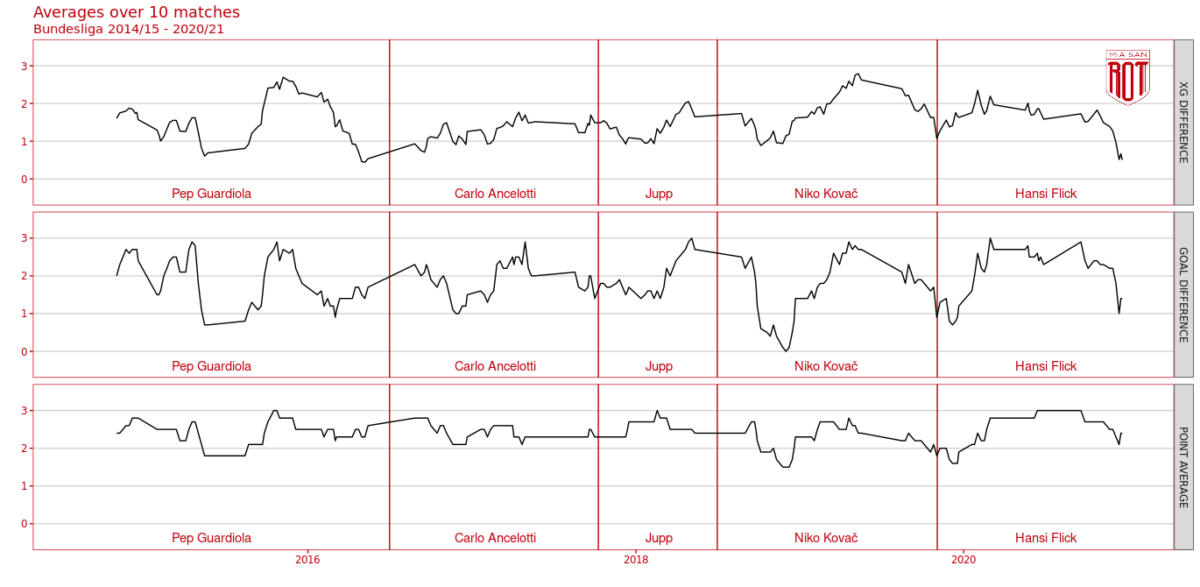
Currently, the team is going through an xG crisis under Hansi Flick. In four of the the last seven matches they have scored fewer xG than their opponents. In fact, the team’s xG difference is currently as low as it has ever been since xG have been recorded. Only in a short period at the end of Pep’s tenure did the team’s xG decline to similar levels.
At the time of their sacking, both Carlo Ancelotti and Niko Kovač were faring significantly better.
The big difference to previous times, however, can be seen when looking at the actual goal difference. Although Bayern have also suffered a dip here under Flick lately, they have scored well over two goals per game for almost the entire time he has been in charge. Under Kovač, the figure even dropped to zero for a short period.
Even more impressive, however, is Flick’s points average. His long plateau with the maximum value of three points per game is impressive.
The team thus seems to manage to continue to achieve the best results despite a less dominant style of play. That, too, can underline the quality of a coach.


[…] miasanrot.com| Popular number cruncher Michael Karbach – better known on Twitter as @BStat – has converted some of the statistics that […] | Miasanrot.com | Read More […]